To give a brief overview, Agent Alerts can provide monitoring of important events or conditions using the alerts feature three different ways:
- SQL Server event alerts – alerts when a specific SQL Server even occurs
- SQL server performance counters – alerts when a performance counter reaches the specified threshold
- WMI events – alerts when WMI reaches a specific threshold
This is important to make sure you are properly keeping an eye on your SQL Server. In my opinion, monitoring WMI events or performance counters with SQL Server is an expensive substitute for a monitoring solution. Thus, we will be focusing on the SQL Server event alerts.
Important Severity Alerts
When implementing this, it is a common practice for DBAs to enable alerts for Severity 17 or higher on their SQL Servers. This is because these are not correctable by end users. Again, I believe everyone should have a monitoring solution in place even if it is just monitoring resources on the machine, for this reason, I only enable them for 18 and above. If you don’t have a monitoring solution though, please enable alerts for 17 also. Error 17 indicates that a statement caused SQL Server to run out of resources.
Full documentation around the severities can be found here.
SQL ERROR Messages
Each error message displayed by SQL Server has an associated error message number that uniquely identifies the type of error. The error severity levels provide a quick reference for you about the nature of the error. The error state number is an integer value between 1 and 127; it represents information about the source that issued the error. The error message is a description of the error that occurred. The error messages are stored in the sysmessages system table.
We can see all the system messages running following statement in query analyzer.
1 2 | SELECT *FROM master.dbo.sysmessages |
The severity level are displayed in the table below.
|
0 to 10 |
Messages with a
severity level of 0 to 10 are informational messages and not actual errors. |
|
11 to 16 |
Severity levels 11
to 16 are generated as a result of user problems and can be fixed by the
user. For example, the error message returned in the invalid update query,
used earlier, had a severity level of 16. |
|
17 |
Severity level 17
indicates that SQL Server has run out of a configurable resource, such as
locks. Severity error 17 can be corrected by the DBA, and in some cases, by
the database owner. |
|
18 |
Severity level 18
messages indicate nonfatal internal software problems. |
|
19 |
Severity level 19
indicates that a nonconfigurable resource limit has been exceeded. |
|
20 |
Severity level 20
indicates a problem with a statement issued by the current process. |
|
21 |
Severity level 21
indicates that SQL Server has encountered a problem that affects all the
processes in a database. |
|
22 |
Severity level 22
means a table or index has been damaged. To try to determine the extent of
the problem, stop and restart SQL Server. If the problem is in the cache and
not on the disk, the restart corrects the problem. Otherwise, use DBCC to
determine the extent of the damage and the required action to take. |
|
23 |
Severity level 23
indicates a suspect database. To determine the extent of the damage and the
proper action to take, use the DBCC commands. |
|
24 |
Severity level 24
indicates a hardware problem. |
|
25 |
Severity level 25
indicates some type of system error. |
As you can see from the descriptions in the chart, the errors typically take your machine offline and can even be results of some serious corruption and loss of data.
Error messages
Next, it is important to also mention that you should set up alerts for the following error messages 823, 824 and 825. These are signs that your underlying storage system having issues and should be investigated by your system administrator and hardware vendor. Additionally, if you receive these messages as a DBA you should check the suspect pages table in SQL server and run a CHECKDB. This will confirm your state of your database. To query your suspect pages table, use the query below, more details about the event types can be found here.
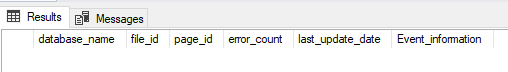
1 2 3 4 5 6 7 8 9 | SELECT db_name(database_id) as database_name, file_id,page_id, error_count, last_update_date, CASE WHEN event_type = '1' THEN 'Error 823 or 824' WHEN event_type = '2' THEN 'Bad checksum on page' WHEN event_type = '3' THEN 'Torn page' ELSE 'restored after was damaged or repaired/deallocated by DBCC' END as Event_information FROM msdb..suspect_pages WHERE (event_type = 1 OR event_type = 2 OR event_type = 3); |
This is what you should see, a nice empty table.
However, to monitor this daily or more frequently, you can use a job to check this table and confirm that the count is zero, if not send an email using Database mail.
SQL Server logs all high severity issues and error messages 823,824 and 825 in the error log inside SQL Server. So, for more details, if the error does not destroy your DB, you will be able to get more information about what happened in there. If your database is lost, Check the event viewer application logs for the SQL Server source. This should contain the same errors with potentially the same or roughly the same information.
Building on this topic a bit more, since we mentioned potential corruption. It is something that can happen to anyone, this will not prevent corruption to your database. In which, you will ask well what can we do to prevent it? Sadly, there is not a good answer, you really can’t prevent it. This is due to the fact you may just be unlucky enough that the first error can be the worst one and you get causes corruption in your database. For example, if the damage is caused to your boot page (1:9), you have no choice but to restore from a backup. On top of that, corruption can come from memory, a bad checksum on a page or your disk.
However, in monitoring these errors it may give you a head start to plan a migration to a new disk subsystem or work with the vendor prior to encountering a problem. This sounds like a ton of work, but it is less painful when compared to recovering corruption or restoring from backup when your system is down.
To summarize at a high level, alerts should be created for:
- Events with Severity >= 18 if you have a monitoring solution, but if you don’t, enable 17 and above alerts
- These are high-severity errors that should be investigated by the system administrator/DBA
- Error 823,824,825 read-retry errors
- These errors spell doom for your disk subsystem
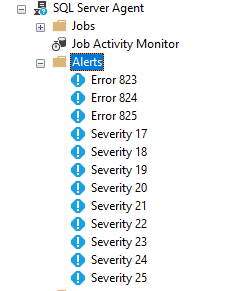
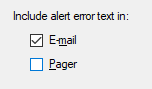
To quickly enable all these alerts and severities, you can run the following code block. This gives you an easy way to customize alert names along with the Database mail operator name without manually configuring all of these alerts by yourself. However, to note, validate your settings are populated or if you want to add anything in the fields additionally, make sure you want these alerts to go to email instead of that old pager in the office somewhere (wink).
 123456789101112131415161718192021222324252627282930313233343536373839404142434445464748495051525354555657585960616263646566676869707172737475767778798081828384858687888990919293949596979899100101102103104105106107108109110111112113114115116117118119120121122123124125126127USE [msdb]GODECLARE @Sev17 Varchar(200),@Sev18 Varchar(200),@Sev19 Varchar(200),@Sev20 Varchar(200),@Sev21 Varchar(200),@Sev22 Varchar(200),@Sev23 Varchar(200),@Sev24 Varchar(200),@Sev25 Varchar(200),@Error823 Varchar(200),@Error824 Varchar(200),@Error825 Varchar(200),@DBMailOperator Varchar(100)SET @DBMailOperator = 'DBA Team'SET @Sev17 = 'Severity 17'SET @Sev18 = 'Severity 18'SET @Sev19 = 'Severity 19'SET @Sev20 = 'Severity 20'SET @Sev21 = 'Severity 21'SET @Sev22 = 'Severity 22'SET @Sev23 = 'Severity 23'SET @Sev24 = 'Severity 24'SET @Sev25 = 'Severity 25'SET @Error823 = 'Error 823'SET @Error824 = 'Error 824'SET @Error825 = 'Error 825'EXEC msdb.dbo.sp_add_alert @Name=@sev17,@message_id=0,@severity=17,@enabled=1,@delay_between_responses=60,@include_event_description_in=1,@job_id=N'00000000-0000-0000-0000-000000000000';EXEC msdb.dbo.sp_add_notification @alert_name=@sev17, @operator_name=@DBMailOperator, @notification_method = 7;EXEC msdb.dbo.sp_add_alert @Name=@Sev18,@message_id=0,@severity=18,@enabled=1,@delay_between_responses=60,@include_event_description_in=1,@job_id=N'00000000-0000-0000-0000-000000000000';EXEC msdb.dbo.sp_add_notification @alert_name=@sev18, @operator_name=@DBMailOperator, @notification_method = 7;EXEC msdb.dbo.sp_add_alert @Name=@sev19,@message_id=0,@severity=19,@enabled=1,@delay_between_responses=60,@include_event_description_in=1,@job_id=N'00000000-0000-0000-0000-000000000000';EXEC msdb.dbo.sp_add_notification @alert_name=@sev19, @operator_name=@DBMailOperator, @notification_method = 7;EXEC msdb.dbo.sp_add_alert @Name=@Sev20,@message_id=0,@severity=20,@enabled=1,@delay_between_responses=60,@include_event_description_in=1,@job_id=N'00000000-0000-0000-0000-000000000000';EXEC msdb.dbo.sp_add_notification @alert_name=@Sev20, @operator_name=@DBMailOperator, @notification_method = 7;EXEC msdb.dbo.sp_add_alert @Name=@Sev21,@message_id=0,@severity=21,@enabled=1,@delay_between_responses=60,@include_event_description_in=1,@job_id=N'00000000-0000-0000-0000-000000000000';EXEC msdb.dbo.sp_add_notification @alert_name=@Sev21, @operator_name=@DBMailOperator, @notification_method = 7;EXEC msdb.dbo.sp_add_alert @Name=@Sev22,@message_id=0,@severity=22,@enabled=1,@delay_between_responses=60,@include_event_description_in=1,@job_id=N'00000000-0000-0000-0000-000000000000';EXEC msdb.dbo.sp_add_notification @alert_name=@Sev22, @operator_name=@DBMailOperator, @notification_method = 7;EXEC msdb.dbo.sp_add_alert @Name=@Sev23,@message_id=0,@severity=23,@enabled=1,@delay_between_responses=60,@include_event_description_in=1,@job_id=N'00000000-0000-0000-0000-000000000000';EXEC msdb.dbo.sp_add_notification @alert_name=@Sev23, @operator_name=@DBMailOperator, @notification_method = 7;EXEC msdb.dbo.sp_add_alert @Name=@Sev24,@message_id=0,@severity=24,@enabled=1,@delay_between_responses=60,@include_event_description_in=1,@job_id=N'00000000-0000-0000-0000-000000000000';EXEC msdb.dbo.sp_add_notification @alert_name=@Sev24, @operator_name=@DBMailOperator, @notification_method = 7;EXEC msdb.dbo.sp_add_alert @Name=@Sev25,@message_id=0,@severity=25,@enabled=1,@delay_between_responses=60,@include_event_description_in=1,@job_id=N'00000000-0000-0000-0000-000000000000';EXEC msdb.dbo.sp_add_notification @alert_name=@Sev25, @operator_name=@DBMailOperator, @notification_method = 7;EXEC msdb.dbo.sp_add_alert @name=@Error823,@message_id=823,@severity=0,@enabled=1,@delay_between_responses=60,@include_event_description_in=1,@job_id=N'00000000-0000-0000-0000-000000000000'EXEC msdb.dbo.sp_add_notification @alert_name=@Error823, @operator_name=@DBMailOperator, @notification_method = 7;EXEC msdb.dbo.sp_add_alert @name=@Error824,@message_id=824,@severity=0,@enabled=1,@delay_between_responses=60,@include_event_description_in=1,@job_id=N'00000000-0000-0000-0000-000000000000'EXEC msdb.dbo.sp_add_notification @alert_name=@Error824, @operator_name=@DBMailOperator, @notification_method = 7;EXEC msdb.dbo.sp_add_alert @name=@Error825,@message_id=825,@severity=0,@enabled=1,@delay_between_responses=60,@include_event_description_in=1,@job_id=N'00000000-0000-0000-0000-000000000000'EXEC msdb.dbo.sp_add_notification @alert_name=@Error825, @operator_name=@DBMailOperator, @notification_method = 7;
What alerts should I enable?
High severity alerts, along with error messages 823, 824 and 825.
How can I quickly enable Database mail alerts in SQL Server?
Run the script in the article above.
Where are Database alerts logged?
High severity alerts are logged to the event viewer in the application log along with the SQL Server error log. Read more in the article above.


No comments:
Post a Comment